Graph Ranking - part 1
Posted on 26/04/2021 by Roberto Cornacchia
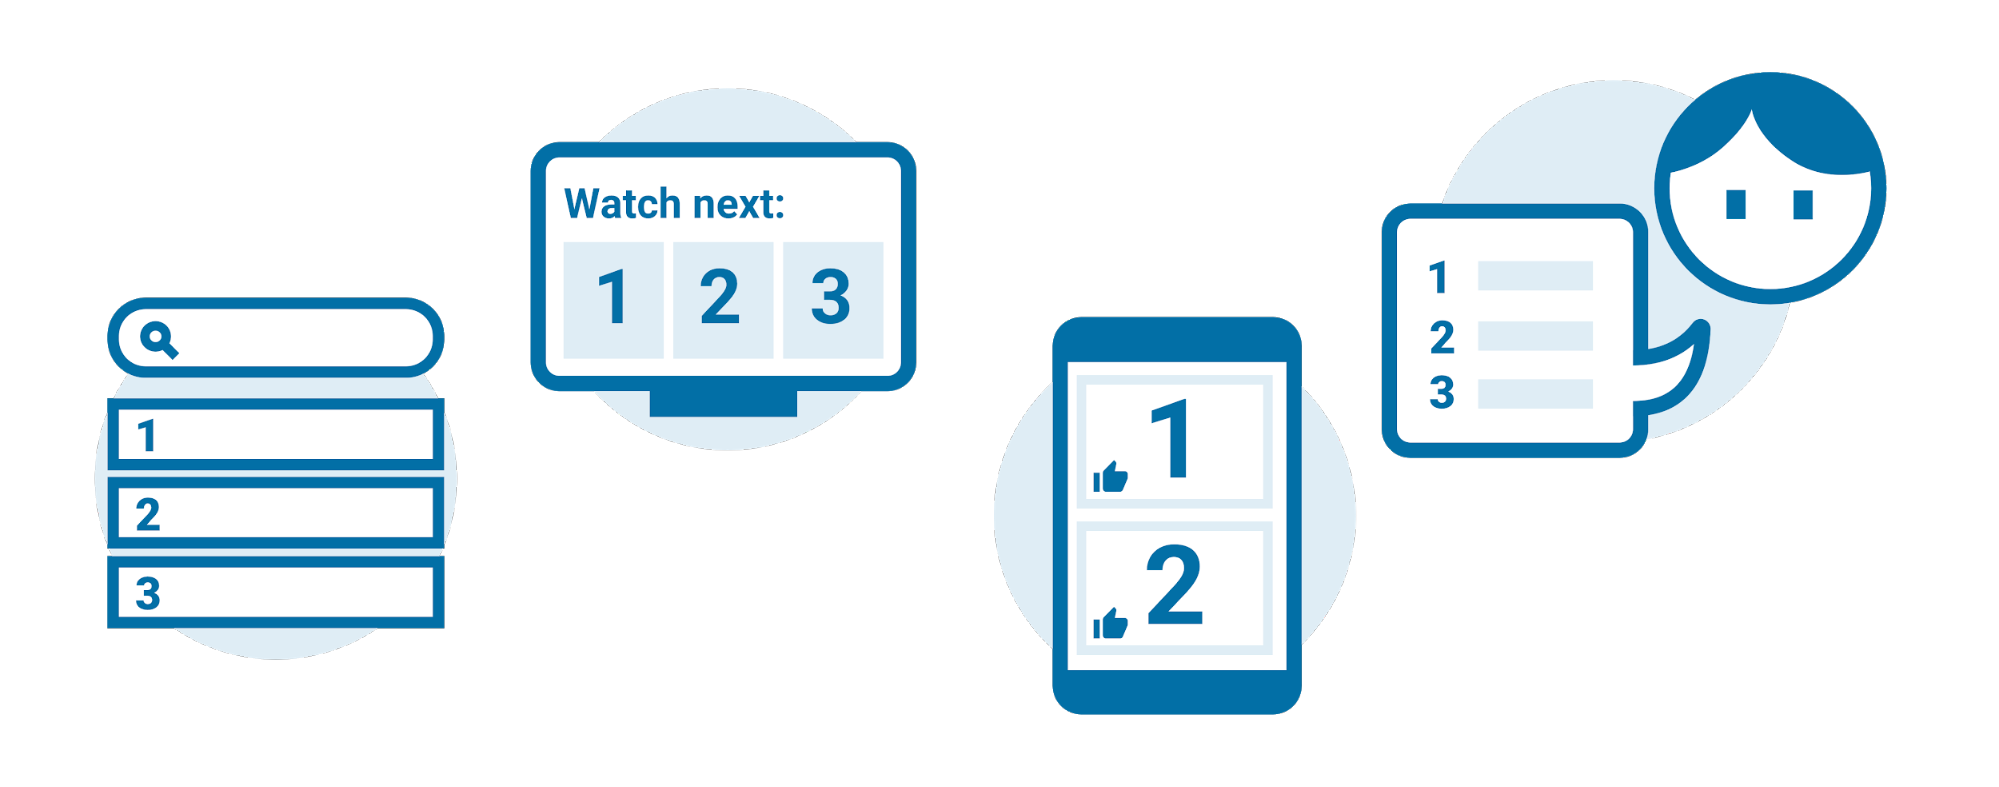
When accessing information on the Web we are continuously interacting with systems that try to determine what is relevant for us. When we use a service to watch a movie or series it suggests what we should watch next. When we listen to music we receive recommendations of other songs that we might like. When we use a Web search engine it shows us the results that help us answer questions within the context of a particular time and place. When we check our social network we see the posts that are most interesting to us.
All these services use some form of relevance to determine what they present to us and what order they present it in. To compute relevance, they use a variety of (user) data and combine a multitude of metrics within their algorithms. In summary, effective notions of relevance have become an essential element for the success of service providers on the Web.
Another key ingredient adopted by the big players on the Web is in the way that they organize their data. Knowledge graphs have become a critical way for enterprises to structure their data. In particular, knowledge graphs help with the integration of data from different sources. Which in turn allows more and different types of data to be utilized when computing relevance.
Spinque helps enterprises to provide relevant results to their users. To do so, we construct a knowledge graph of the data within an enterprise, and when needed enrich it with external knowledge. Together with the enterprise's domain experts, we study the search tasks of their users and determine the appropriate notions of relevance.
Users are more than accustomed to consuming lists of results that are ranked by their relevance to a query. Somewhat intuitively, they also understand that exploiting the connections existing among data points can enable new and interesting ways of defining what is relevant. For example, we easily accept the idea that our favourite social network shows more information about people whose interests are similar.
Exploring how the concepts of relevance and ranking can be modeled and used within knowledge graphs is the topic of this series of posts: Graph Ranking.
IMDB sample as a Graph
In the following, we are going to use a small sample of data coming from IMDB, turn it into a knowledge graph, and explore a number of increasingly complex ranking scenarios with the help of Spinque Desk, our search design framework.
We constructed a graph out of two CSV datasets that are publicly available on Kaggle:
- IMDB Spoiler Dataset: a subset of 1572 movies for which a review containing spoilers was identified. We are not particularly interested in spoilers here: we selected this dataset because it was a clean sample of data.
- IMDB Dataset: Basic information about movies: title, average rating, genre, plot summary, etc.
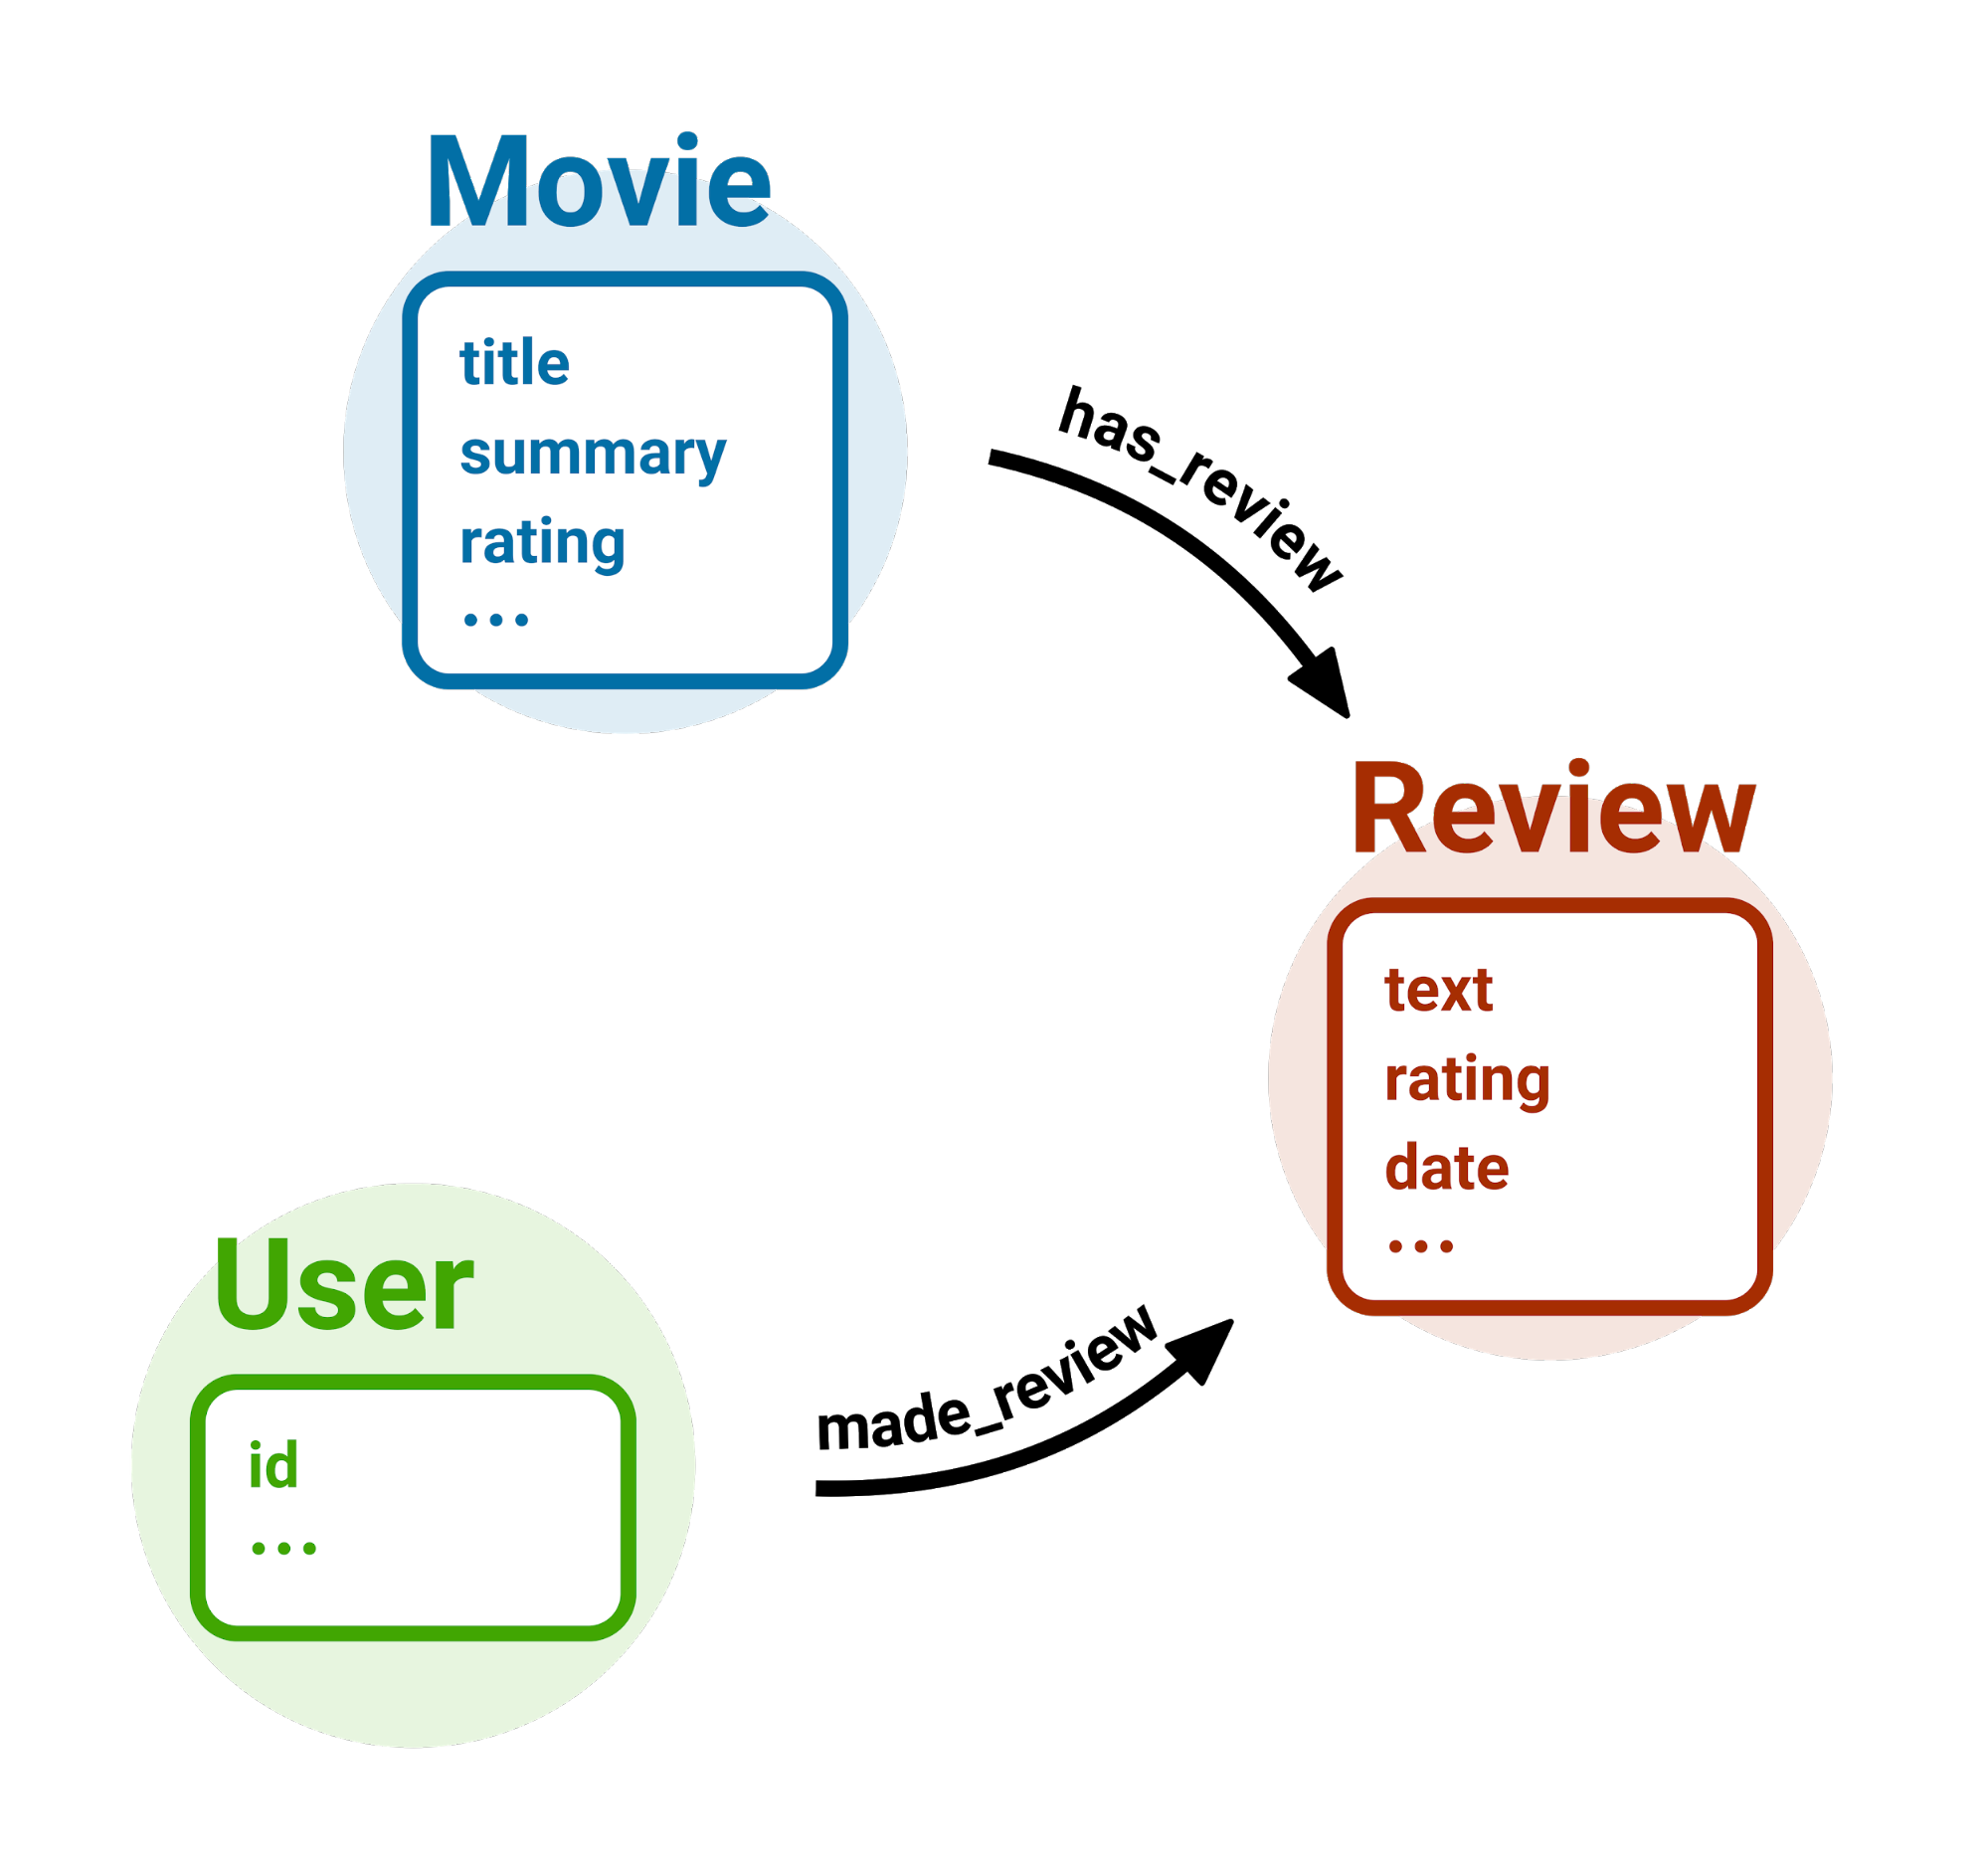
The resulting graph is extremely simple. It depicts a situation where a user writes one or more reviews and a movie has one or more reviews.
Unranked movies
Once the graph is ready (preparing the graph is not detailed in this post), let's design our first ranking strategy. We want to start from the simplest possible ranking: retrieving all movies, without any ranking. Technically, this can be seen as a form or ranking where the ranking function returns the same constant value for all inputs.
In terms of our knowledge graph, all we need to do is to select the sub-graph containing only nodes representing movies.
We have named the graph 'spoilers'. We use the block Filter by Class to select only those nodes with type http://imdb.com/Movie.
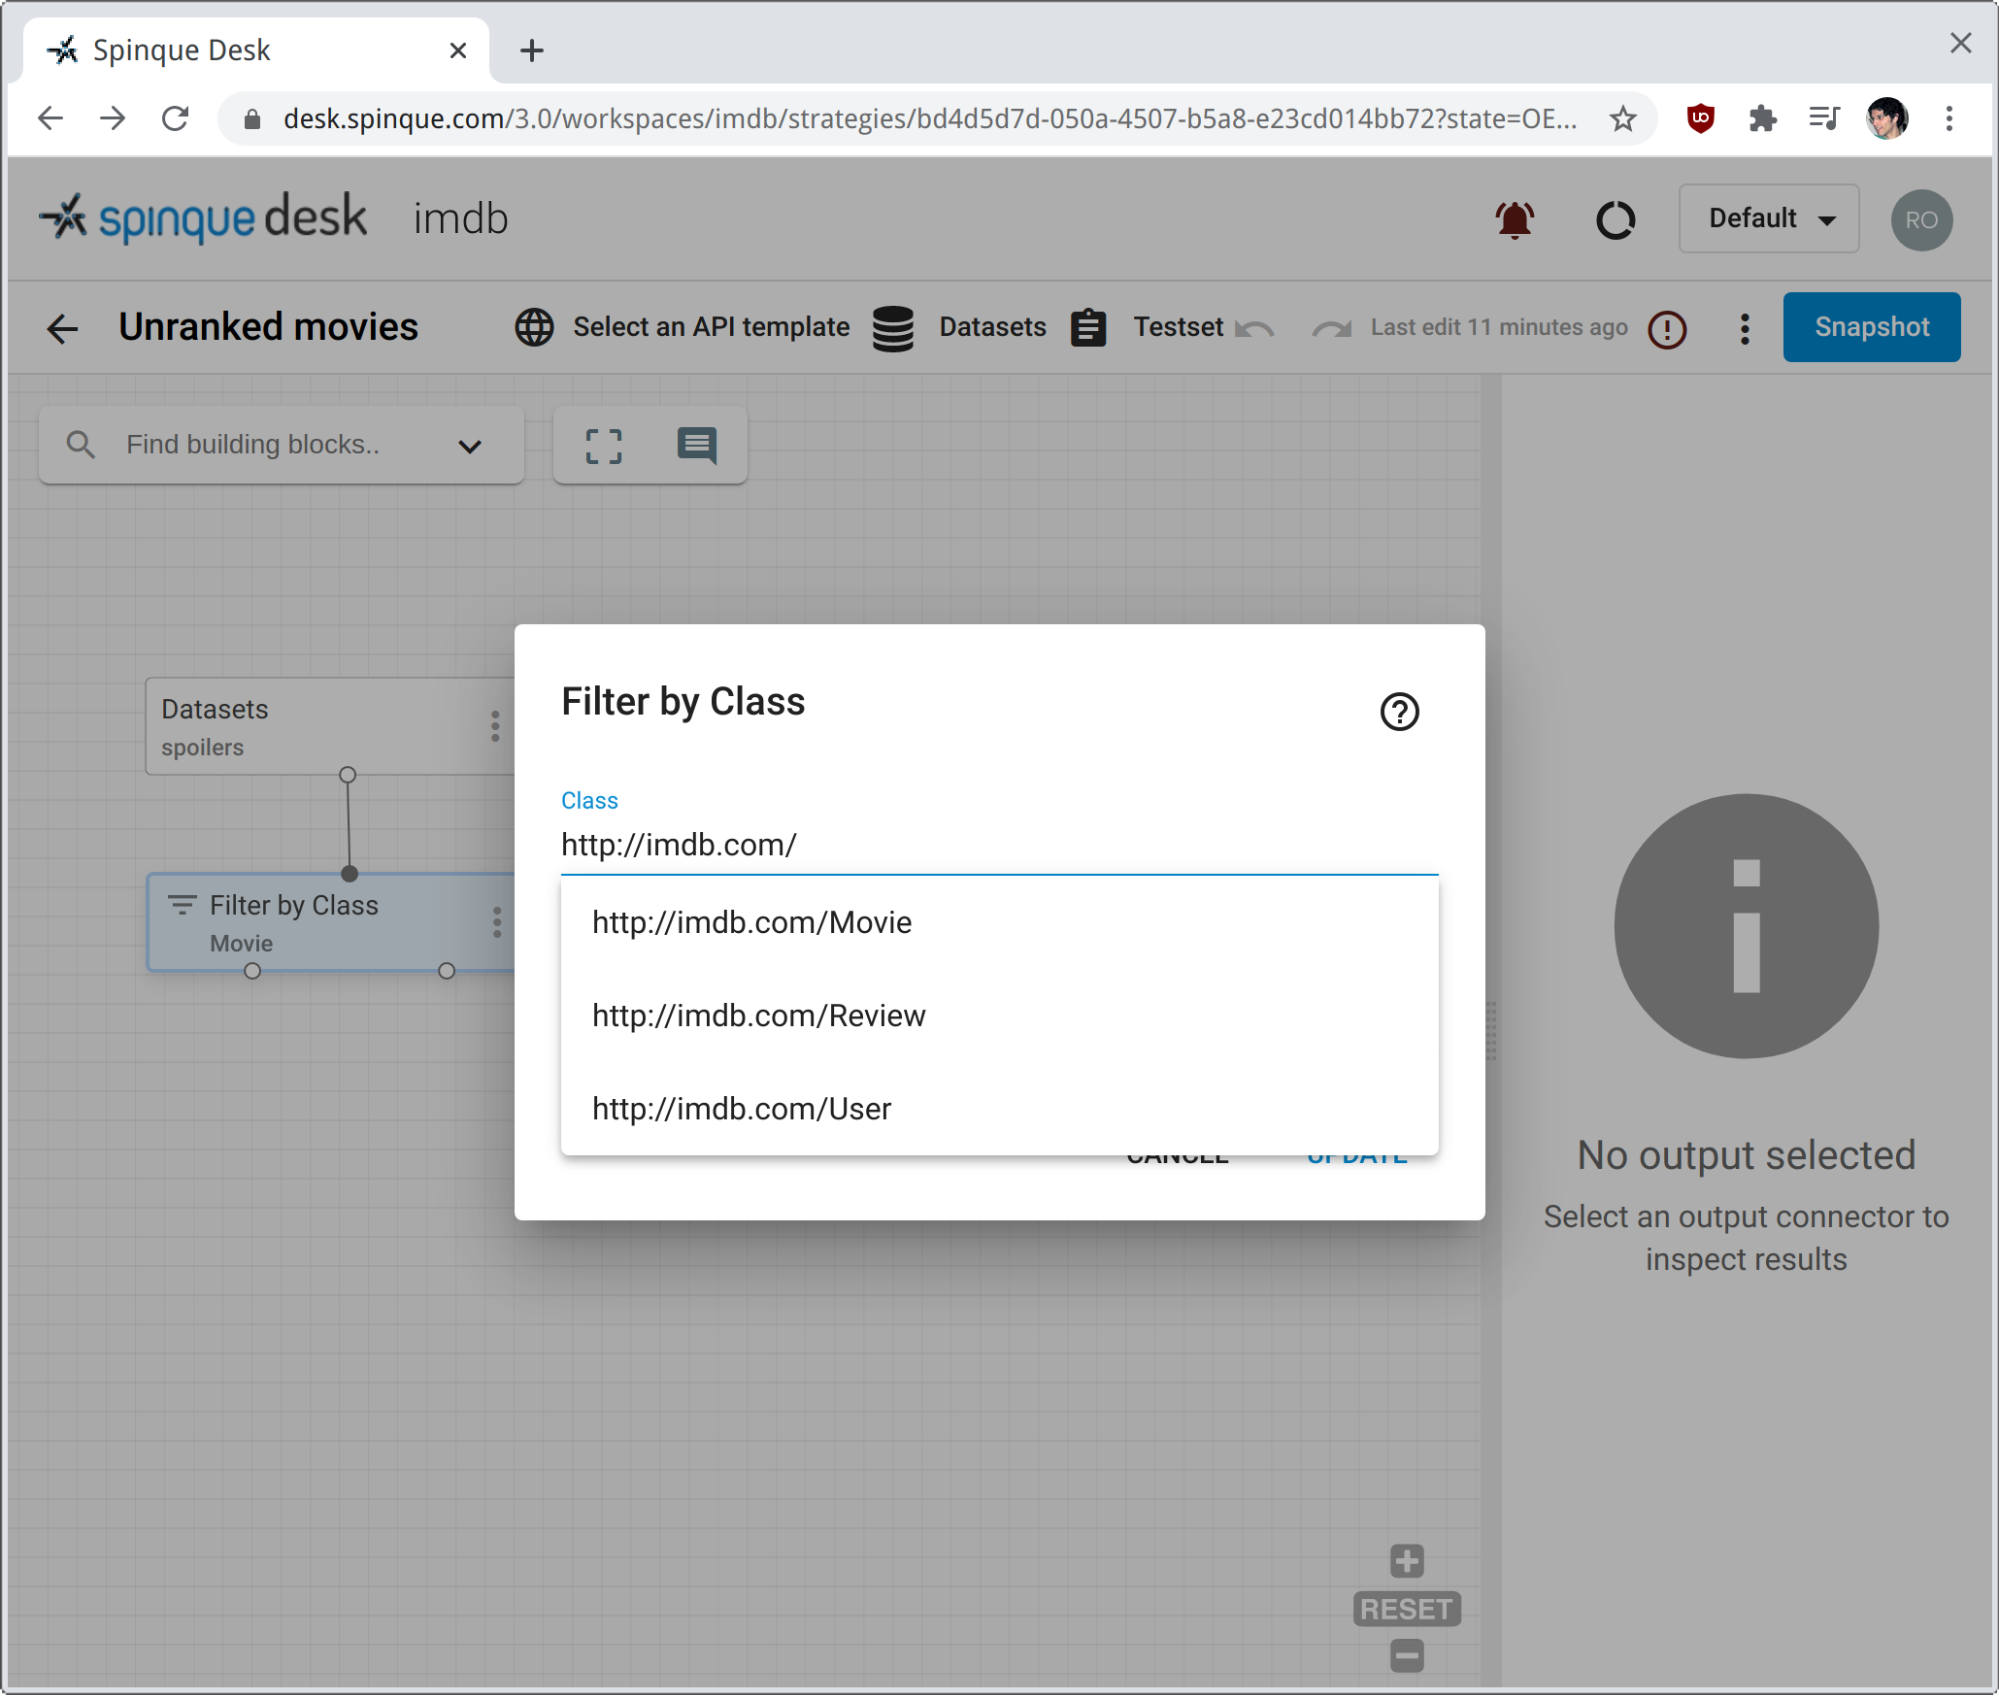
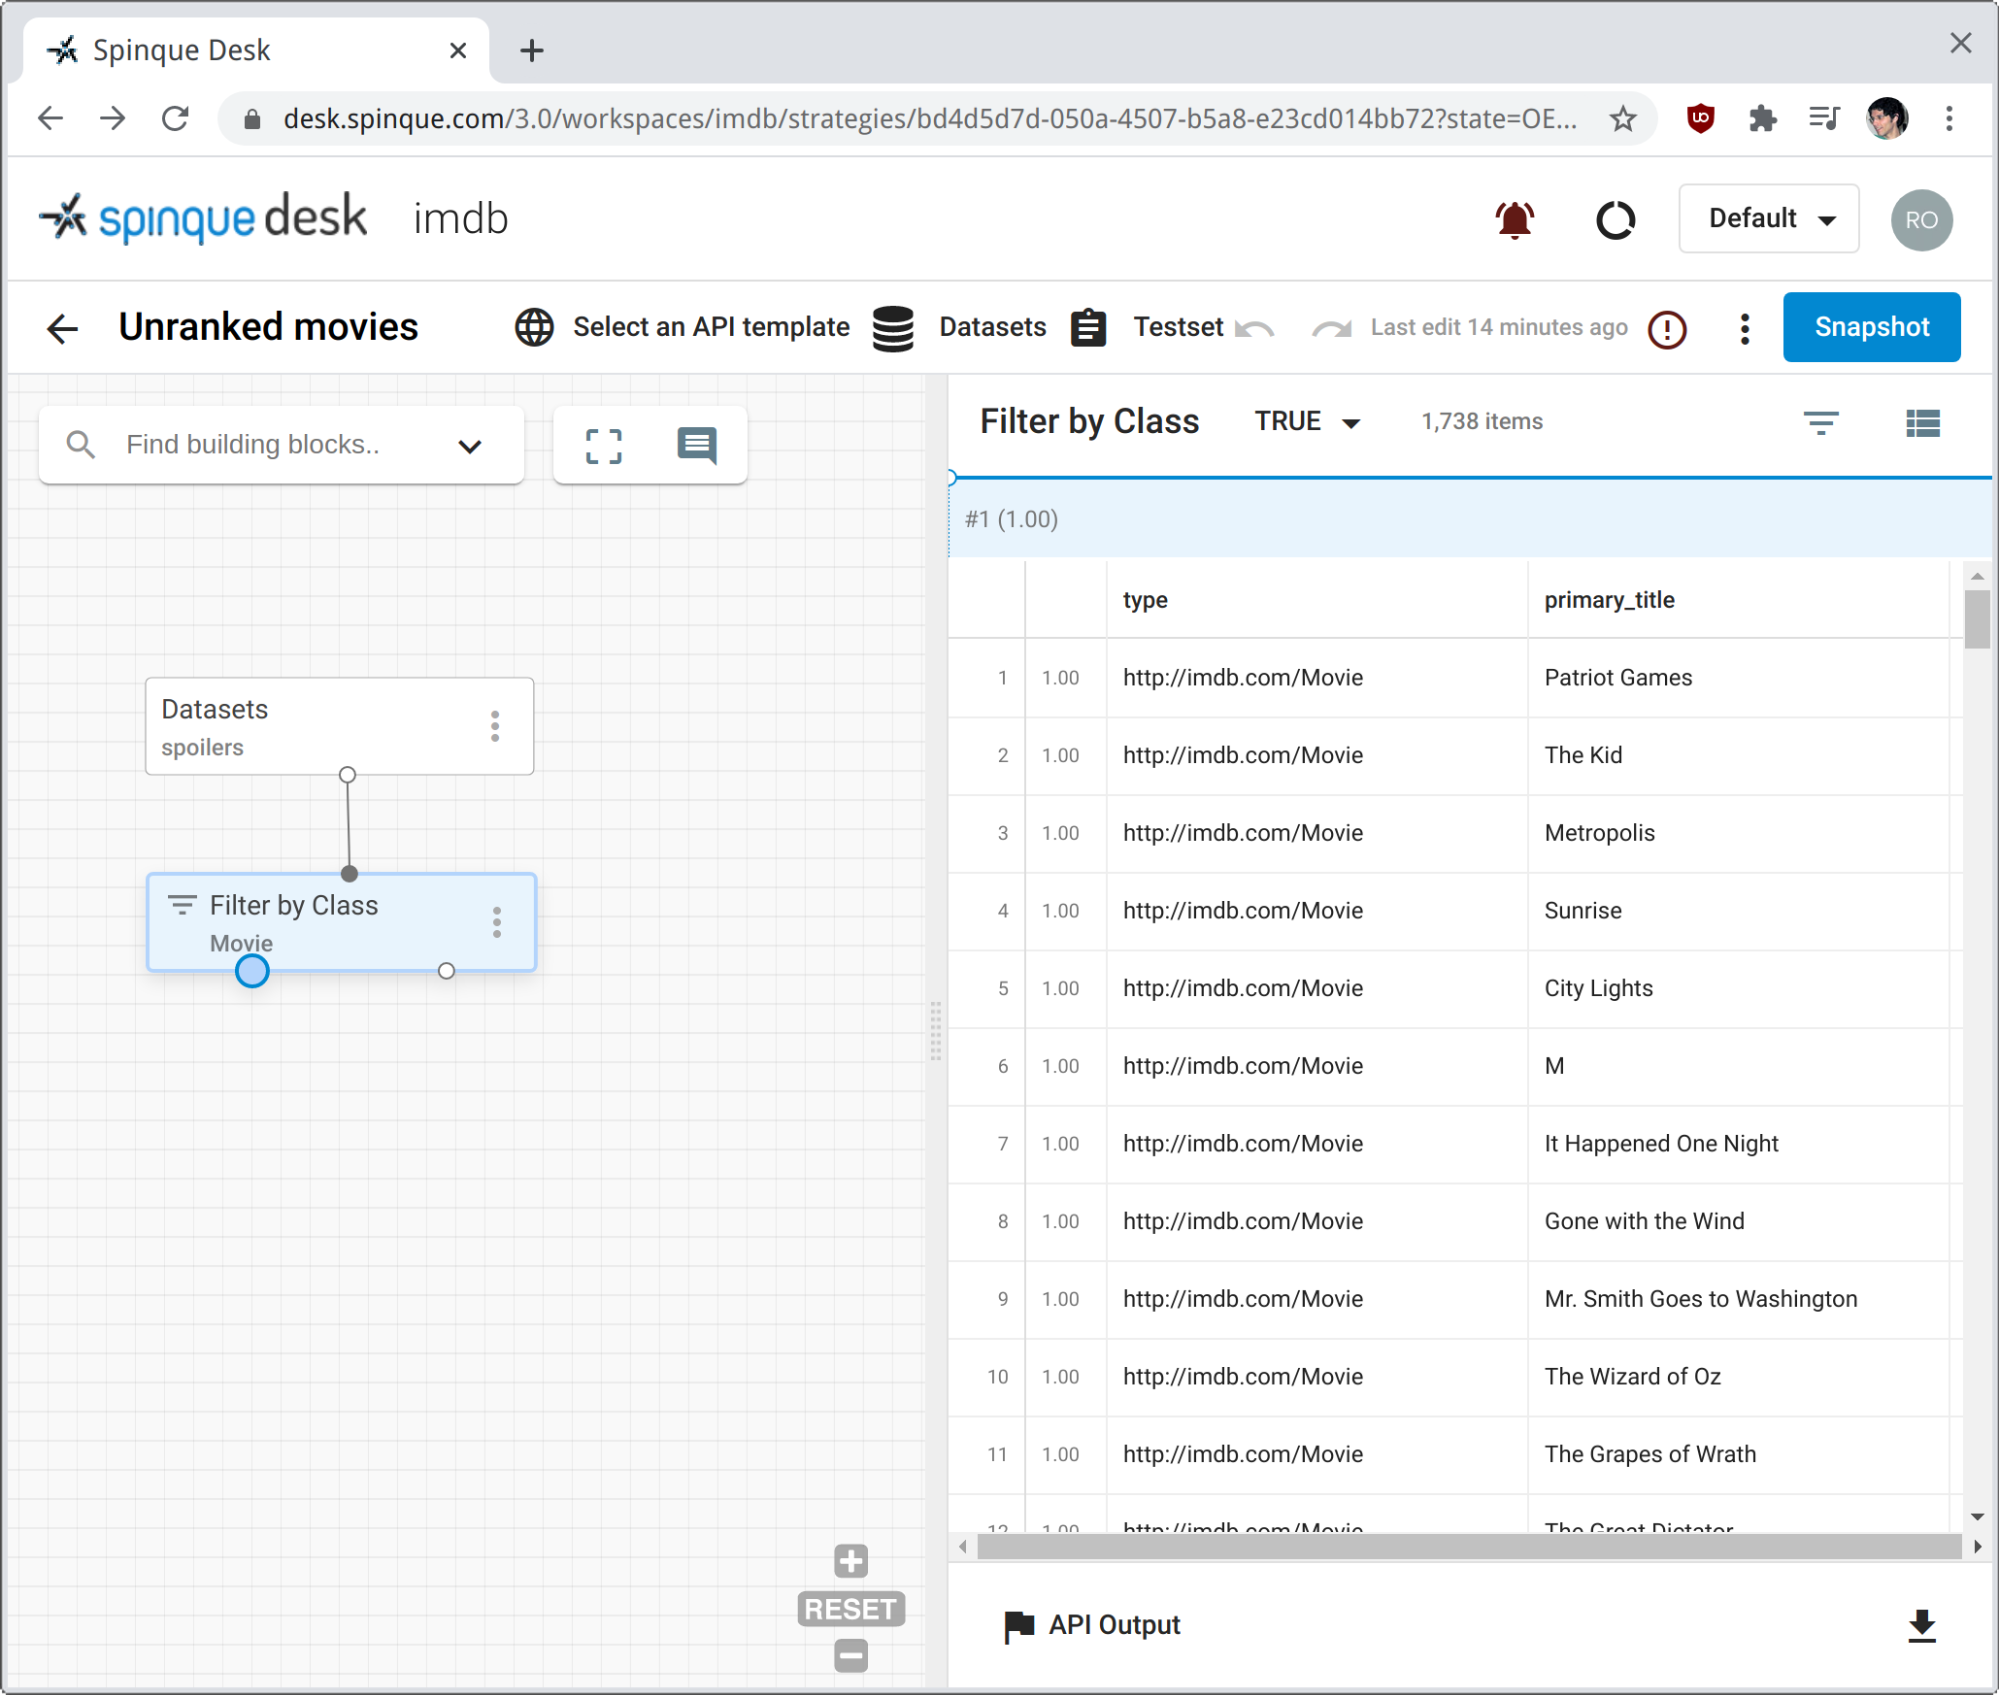
Clicking on the TRUE output pin of the filter block retrieves all nodes that satisfy the condition class = http://imdb.com/Movie.
The right panel gives us a simple preview of the nodes selected. The main properties of each movie are displayed, along with their probability of relevance. Trivially, they all have probability 1.0, as defined when creating the graph from raw data.
Ranking movies by ratings
The first actual ranking that we perform is based on the average ratings already present in the data at hand. These ratings are floating point numbers ranging from 0 to 10. To rank movies on them, we use block Rank by Double, which we apply directly on the output of the sub-graph of movies from the previous section.
![]()
The block is configured with a node Property (rating in our case) and a query Value. For each node in input, the value of the specified property is compared against the query value. The result of this comparison determines the score assigned to each node, and eventually its probability of relevance in the final ranking. Note from the screenshot that we have configured Value to be instantiated with the value of query parameter rating.
![]()
To simulate user input, we prepare a Testset with a few ratings to compare to. We click on the CLOSE output pin of the ranking block to rank movies by how close they are to the given rating. The screenshot shows the result of choosing 0 as input value. That is, we asked to see the most disliked movies on top of our ranking.
The light-blue curve on top of the result preview gives an idea of the probability (of relevance) distribution over the result set.
For the daring reader
Both the filter and the rank block seen so far can be configured further.
-
They both include a check-box to consider the sub-classes and sub-properties of those configured in the block, as defined by RDF Schema. This is only applicable if the knowledge graph has been modelled using rdfs:subClassOf and rdfs:subPropertyOf relations.
-
The rank block can optionally perform hard filtering of results prior to ranking, and the slope of the ranking curve can be controlled by an additional parameter.
-
Parameter Score Aggregation is present in almost all blocks and it has to do with duplicates in the result sets. The same node could be retrieved via different paths in the sub-strategy preceding the current block, thus with different scores. We can then choose to keep all the duplicates, or to keep only the one with maximum or minimum score, for example.
-
Finally, all blocks can have multiple outputs, which can all have zero or more connections to other blocks.
- Most filtering blocks have outputs TRUE and FALSE, delivering results matching and not matching the filtering condition, respectively.
- Most ranking blocks have outputs CLOSE and FAR, ranking results by how close or how far they are from the reference value. In other words, output FAR inverts the ranking function of the block.
In the first post of this blog mini-serie about graph ranking we introduced a well-known domain and some simple ways of defining relevance and ranking over graph nodes within Spinque Desk.
Stay tuned for the upcoming second and third parts of this mini-series, where increasingly complex (and interesting) ranking options will be explored. We will talk about text ranking and get more in detail about how the graph relationships can be used to improve the ranking.