Kafka Latency
Posted on 18/06/2019 by Kay Werndli
Here at Spinque, we are constantly trying to improve our products and always have an open ear for feature requests from our clients. Now, new features are always nice but we want to make sure that the end-user experience is not negatively affected by it. In particular, we want to make sure that the end-user (i.e. the clients of our clients) can expect quick responses from our systems. In other words: we want to not just deliver new features that work but also new features that have a low latency.
Recently, one major feature that was requested was being able to do live updates of existing databases. You see, up to this point, all the data that we got from our clients to run search strategies on is treated as a static entity. We would regularly receive updated versions of the data, rebuild everything and swap out the old datasets for the new ones. This works really well for most cases but sometimes, you want to be able to add in new data on the fly, without having to go through a lengthy re-indexing process. This all seems fairly straightforward and you may rightfully ask what the big deal is.
Up until now, when you as a client worked with Spinque, all your data would be stored on multiple, independent servers and each one of these is able to perform every search task that you give it. The fact that there are multiple servers is not very surprising and basic good practice anywhere where you deal with important data (just think of your own personal backups). Moreover, because we provide a service to our clients and their users, we need to make sure that this service has good availability (i.e. can tolerate the failure of a machine or two) and scalability (if demands are high, we can add more servers that are able to deal with requests). The important word however is that these servers are independent. So these servers are not aware of each other's existence and there is no communication between them. The only place where the existence of multiple servers is apparent is to the load balancer, where the user requests arrive and who decides which server should deal with them. This poses a problem for live updates because all changes that arrive at one server need to be propagated to the others and making sure that the data on the different servers stays in sync.
So, in order to implement the requested feature, we had to start investigating different possibilities to allow the servers to talk to one another. Of course, you could just implement your own little peer-to-peer system but you really don't want to dive down that rabbit hole; especially not if these aren't just simple point-to-point connections but instead, the messages need to be broadcast to all servers and have to be persistent. So for example, if a server was offline when the message was sent, you need to make sure that the server still gets to see it, once it comes online again. The industry standard to approach this problem nowadays is Apache Kafka. We're not gonna delve deeper into it as there are more than enough resources where you can read up on the basics (e.g. here or here). Suffice it to say that Kafka is an open-source persistent distributed messaging system, which means that producers can post messages to a topic in a Kafka cluster, while consumers can then retrieve them. Now, while persistence is key for us and one of the big strengths of Kafka, latency is a much less advertised issue.
When we talk about the latency in the context of Kafka, what we mean is end-to-end latency; i.e. the time it takes from the moment that a producer posts a message to a topic in the cluster, until it is seen by a consumer subscribed to that topic. Obviously, there are many factors influencing this latency, the most obvious of which (and that are not specific to Kafka) are
- latency of the network
- load of the Kafka brokers (which is what one calls nodes that participate in the Kafka cluster)
- message size
- buffering
Another factor that is more specific to Kafka is the topic's replication factor; i.e. how many copies of the messages in the given topic are stored on the different brokers and are kept in sync. The way it works is that every topic consists of a (configurable) number of partitions and for every such partition, one of the brokers is the leader and all requests concerning messages in that partition go to that leader. The other brokers can act as followers, which means that they do not handle requests but they keep copies of all messages in case the leader goes down. Now, if a producer posts a message to a topic, it gets assigned a partition and sent to the corresponding leader. The leader then distributes the new message among the followers and once they have received and stored the message, they send back an acknowledgement. Only once every follower has acknowledged the message does the leader make it visible to consumers. So, if a topic has a replication factor of 1 (meaning there are no followers), we don't have wait for any followers to come in sync, whereas, if the replication factor is 3, we have to wait for two other machines to deal with the message before we hand it out to consumers.
Depending on the application at hand, latency might be important or not. For example, if the messages you post trigger a long and complex calculation on the receiving machines, latency is not really all that important. On the other hand, if the calculation is only short and some user is waiting for the result (such as in our case), then latency becomes a much bigger deal. A hypothetical scenario (which is not what we are doing but let's consider it anyway) would be load balancing. If a user request arrives at the load balancer, it would simply post it to a Kafka topic. The servers would all be subscribed to that topic, one of them receives the message, deals with the query and sends the result back. Because the user is waiting for the result of their request, it would be very important to have a low latency and we were interested to know what kinds of latencies we can expect.
If you already know the basics of Kafka and are not interested in more background to this story, feel free to skip to "the good parts" in the "Results" section. Also, all code of the latency benchmark program I wrote is available on Github.
Cluster latencies
If you google "Kafka latency" you will quickly stumble upon a couple of articles such as the recent one here and an older one here as well as an old Stackoverflow question (both also mentioned in that first article) and a more general article here. The problem with the first resource (as well as most of the stuff you find on Stackoverflow etc.) is that it is done on a single machine. Now, you can absolutely run multiple Kafka brokers on a single machine but we were interested in benchmarking the more realistic scenario where the brokers are different machines in a LAN. Now, this is measured in the second article but that one is rather outdated and written by a LinkedId employee (LinkedIn develops Kafka and so, there might be some biases there). Even worse, when we did some quick and dirty benchmarks on a small Kafka cluster hosted on a couple of developer machines in our offices, we got some very different results but we'll get to that. Let's instead talk about our setup first. The Kafka cluster consists of three machines that all run an instance of Kafka (version 2.2.1) and Zookeeper (a dependency for Kafka, version 3.5.5) each. Moreover, one of these machines also runs the benchmark. These machines have rather modest hardware consisting of
- a quad-core Intel Core i7-4790S @3.2GHz;
- 16GB of RAM;
- a 500GB Samsung EVO 840 SSD;
- a Gigabit Ethernet connection.
The Kafka brokers, producer and consumer are all using the default configurations; so in production, you might be able to achieve better latencies by tailoring parameters to your specific circumstances. The only thing that's worth mentioning is that we use enable.auto.commit=false for our consumer. We also use acks=0 for our producer but that's irrelevant because we have to wait for acknowledgements anyway until messages are distributed to the consumers.
The way we measure latencies is very simple: We fix a message size (in our case 100 bytes) and always send a raw byte array consisting of nothing but zeroes except for the very first 8 bytes, where we put the result of calling System.nanoTime(). On the consumer end, we simply take the first 8 bytes of every message received, reconstruct the long value stored in it and compare it against the current System.nanoTime(). So, all in all, on the producer side, we have:
Properties config = new Properties();
config.put("bootstrap.servers", bootstrapServers);
config.put("acks", "0");
producer = new KafkaProducer(config, new ByteArraySerializer(), new ByteArraySerializer());
and for posting messages, we use:
  byte[] payload = new byte[Math.max(8, params.msgSize)];
  long now = System.nanoTime();
  byte[] nowBytes = Utils.longToBytes(now);
  for(int i = 0; i < 8; ++i)
    payload[i] = nowBytes[i];
  ProducerRecord record = new ProducerRecord(params.topic, payload);
  producer.send(record);
The params structure is used to store command line parameters, such as message size and topic name, and the longToBytes method, we wrote ourselves. Conversely, on the consumer side, we initialise things like this:
Properties config = new Properties();
config.put("client.id", "TestClient");
config.put("bootstrap.servers", bootstrapServers);
config.put("enable.auto.commit", "false");
consumer = new KafkaConsumer(config, new ByteArrayDeserializer(), new ByteArrayDeserializer());
consumer.assign(Collections.singleton(new TopicPartition(params.topic, 0)));
consumer.seekToEnd(Collections.singleton(new TopicPartition(params.topic, 0)));
and calculate latencies by
ConsumerRecords<byte[], byte[]> records = ConsumerRecords.empty();
records = consumer.poll(Duration.ofMillis(100));
long now = System.nanoTime();
for(ConsumerRecord<byte[], byte[]> record : records) {
  long diff = now - Utils.bytesToLong(record.value());
  times.add(diff);
}
Again, the function bytesToLong (which is the inverse of longToBytes), we wrote ourselves and times is simply a list where we store all the measured latencies for later evaluation.
So far so straightforward. According to the second article mentioned above (which is the only one testing end-to-end latency in a LAN), we should expect latencies to be around 2-3ms, even for a replication factor of 3. However, when we ran our first tests, we only measured the average latency because we simply wanted to get a first overview. As most people will immediately point out, this is really bad practice and me, as a mathematician, even knew this but thought I could get a away with it (better luck next time...). What we got were wildly varying average latencies. Sometimes, they would be around 6ms (which is still much higher than what we expected) and sometimes, they would be in the >100ms range. Suffice it to say that we were pretty stumped. At first, our suspicion was that there was some network issue because if we ran everything on a single machine, things were working smoothly. Yet, when reducing the replication factor to 1 (so no syncing via LAN had to be done), the inconsistencies were still there. Sometimes, we would see sub-millisecond latencies and sometimes latencies of 10ms or more. This sort of indicates that the LAN might not be the issue (even though we still use the network to post and receive the messages).
Finding the Culprit
The next step in identifying the problem was to move away from only calculating averages. So instead of simply summing up all measured times and then dividing by the total number of messages to get the average, we store all times in a list, sort it and calculate percentiles as well. The only thing that revealed were even more inconsistencies. Sometimes the median, 90th, 95th and 99th percentile were reasonably close together (albeit still way too high) and other times, the variance was just abysmal. Still suspecting that there is some network issue, in desperation, we tried to remove all unnecessary network access. For example, because the Kafka and ZooKeeper code resided in an NFS-directory, so all machines could easily access it, the two programs silently decided that it was a good idea to also store log files there (not message logs but for example, logs about the garbage collector). Alas, manually changing the necessary values to point to a local path didn't change anything.
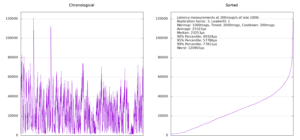
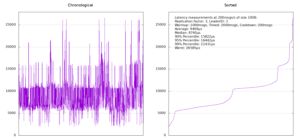
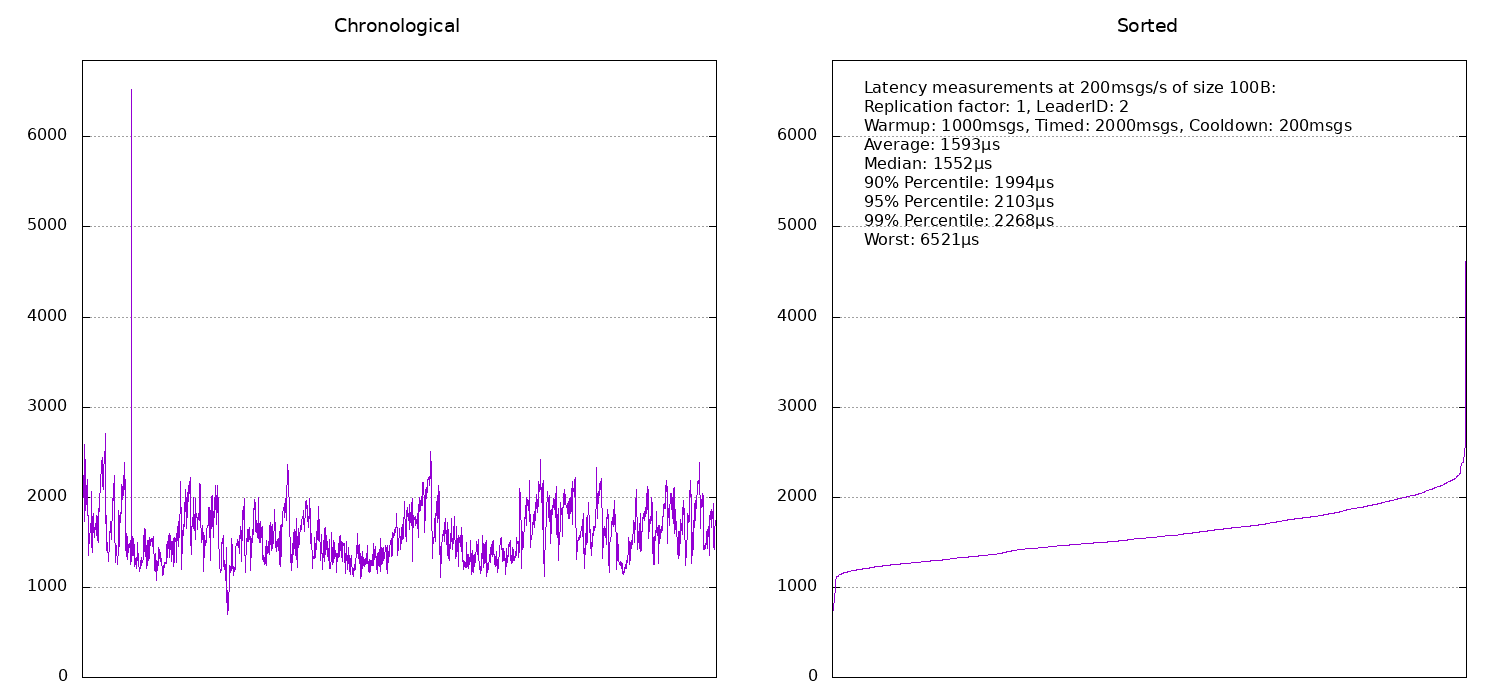
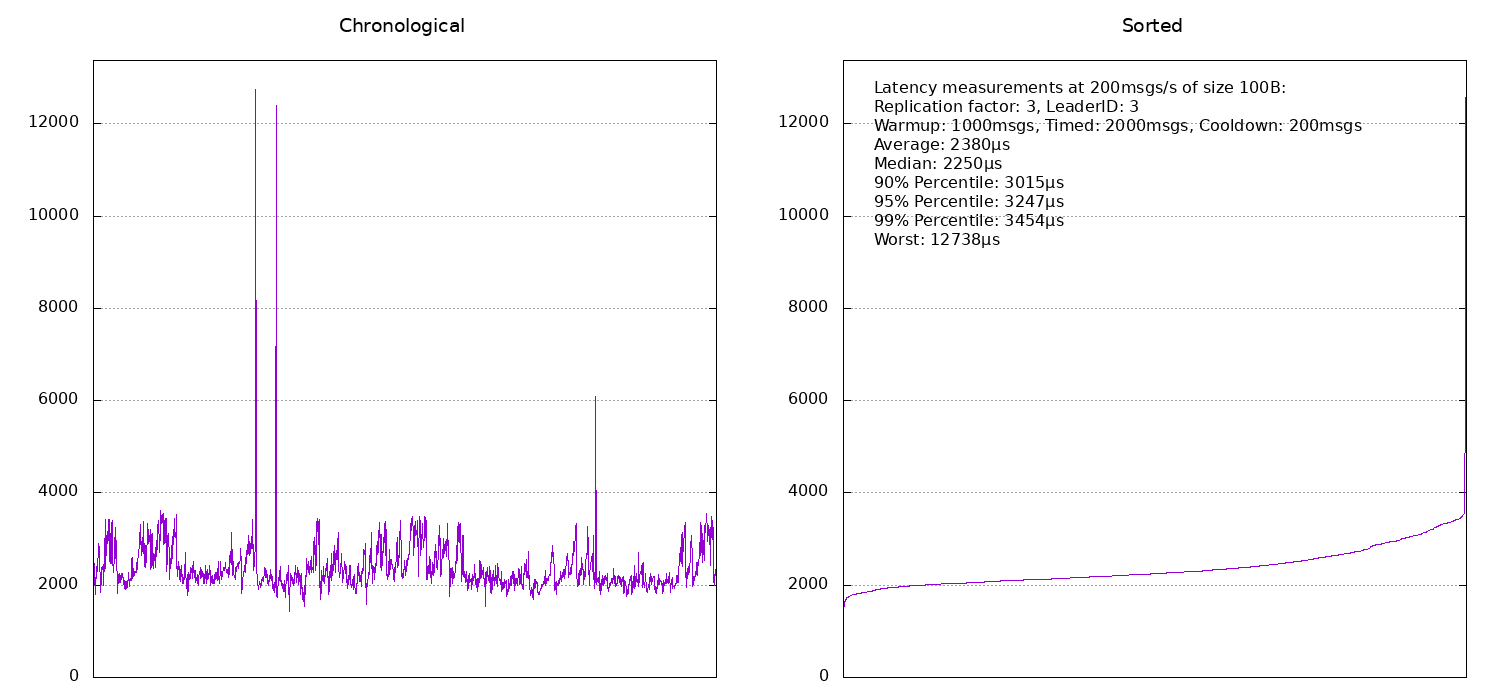
To better see what was going on, we then started using gnuplot to plot "histograms" (really bar plots) of our measured latencies and this gave us some interesting results. Sometimes, the latency histograms looked smooth and other times, they would reveal a couple of modes, meaning latency times that are far apart and where a lot of values would cluster around. To give you an idea, here are two examples of what they looked like (at the time, we only had the right-hand plots and only the average and the information about the different percentiles):
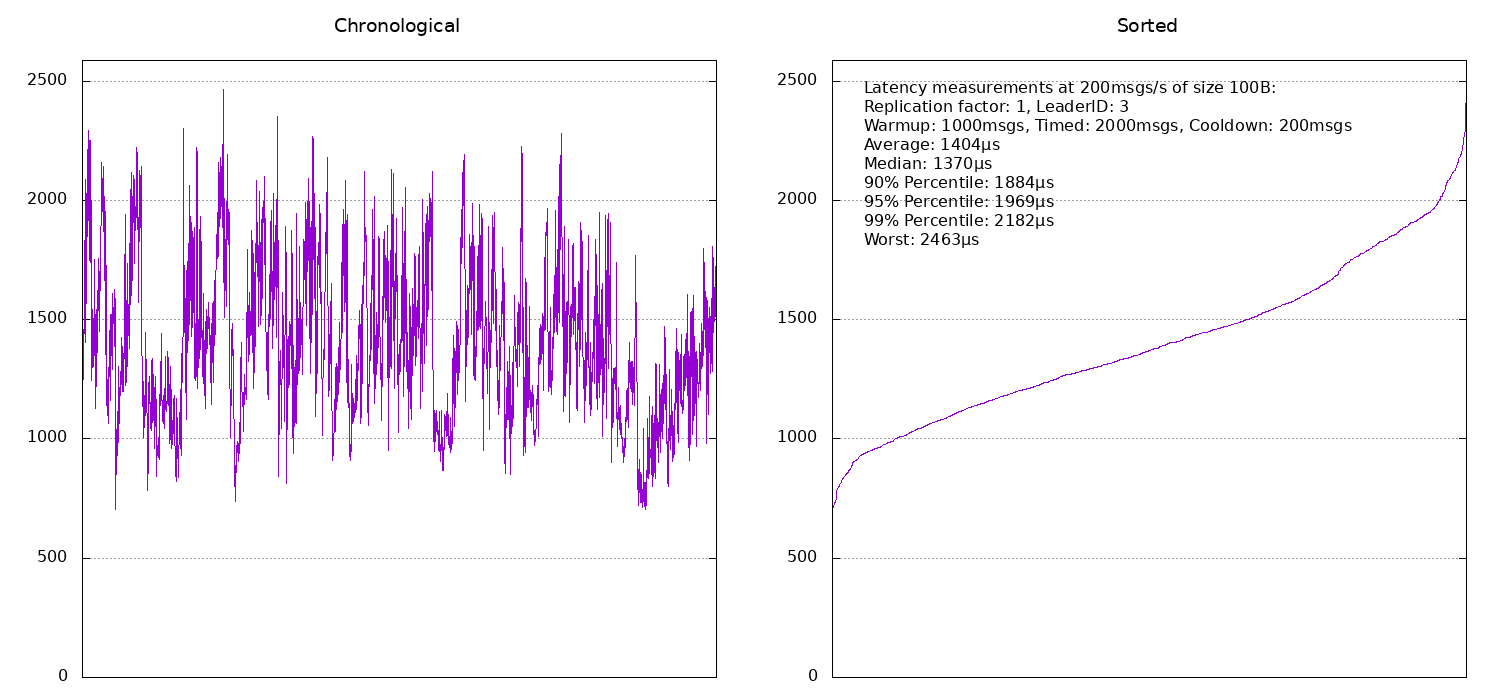
Still not sure where this inconsistency stems from, we decided to once more reduce the replication factor to 1 and run the same test, yielding similar results:
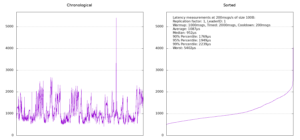
At some point, something in our heads clicked and we noticed that we had been totally disregarding who the partition leader was and once we started displaying that information, too, things became a lot clearer. There seemed to be one machine (broker number 3) that consistently gave us much worse results whenever it was the leader. We then started plotting the latency timings in chronological order as well (the plots on the left above) and as is clearly visible in the replication factor 1 case, things look very different if broker number 3 was the leader. By the way, there doesn't seem to be any way in Kafka to enforce a leader for a partition. Instead, what we had to do was to create the topic, check if we got the right leader and if not, delete the topic again and recreate it until we succeeded.
Another thing that we learnt from having chronological plots (and which is very obvious in hindsight) was that we not only need a round of messages as a warmup (which everyone thinks of) but also a round of messages as a cool down. Otherwise, the last couple of messages will be buffered and give you a latency peak at the end.
We never fully understood what was going on with the machine on which broker 3 was running as it wasn't under any significant load or anything like that. It might be some misconfiguration somewhere or a bad cable, who knows. In the end we simply decided to switch over to a different machine and see what happens there.
Results
Once we removed the bad machine from our cluster, things started to become much more consistent and closer to what article number two was promising. First, we ran a couple of tests with a replication factor of 1 and got the following results:

As you can see, apart from the occasional spike in latency (which could be caused by anything), the latencies are pretty consistent. If the same machine that is running the benchmark also happens to be the partition leader (broker number 1), then the latency is around 1ms. If it is another machine (so we have to communicate via the network), typical latencies are around 1.5ms.
Moving on to a replication factor of 3, the latency obviously increases:
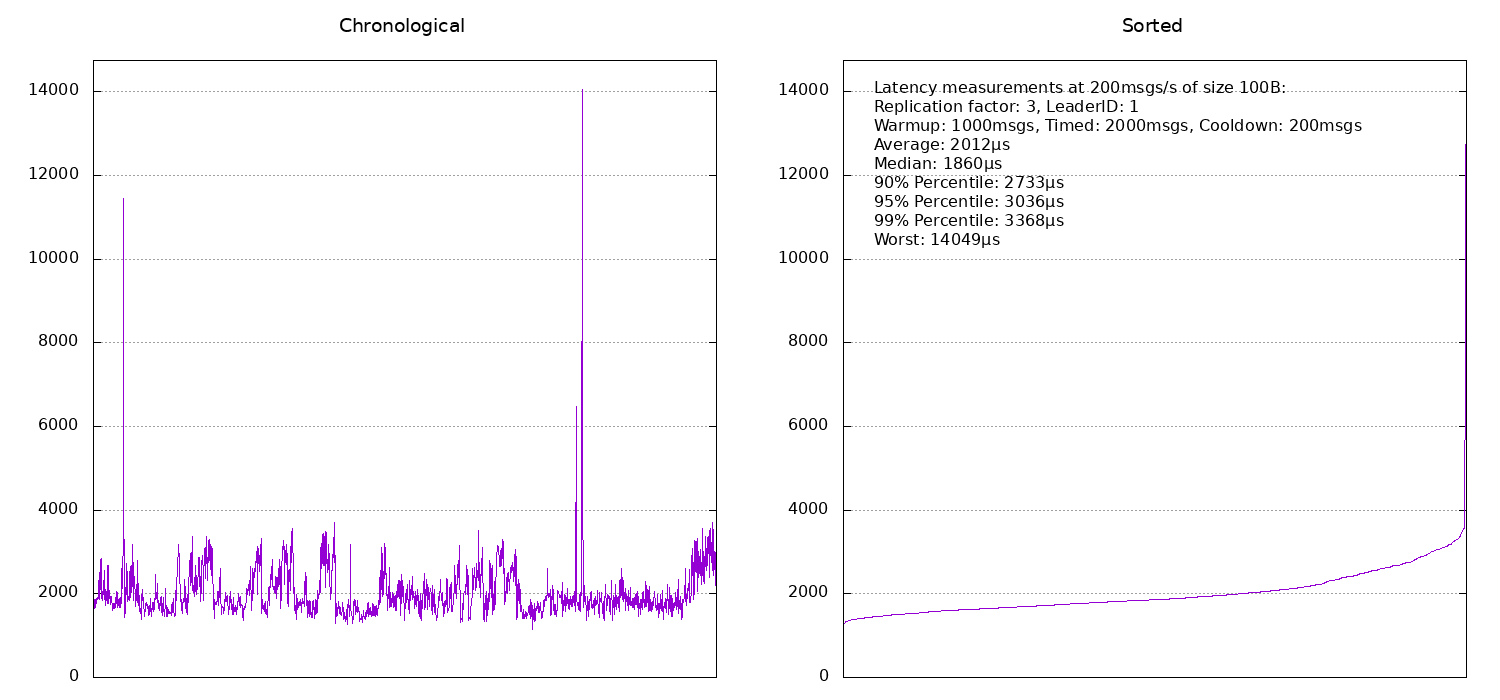
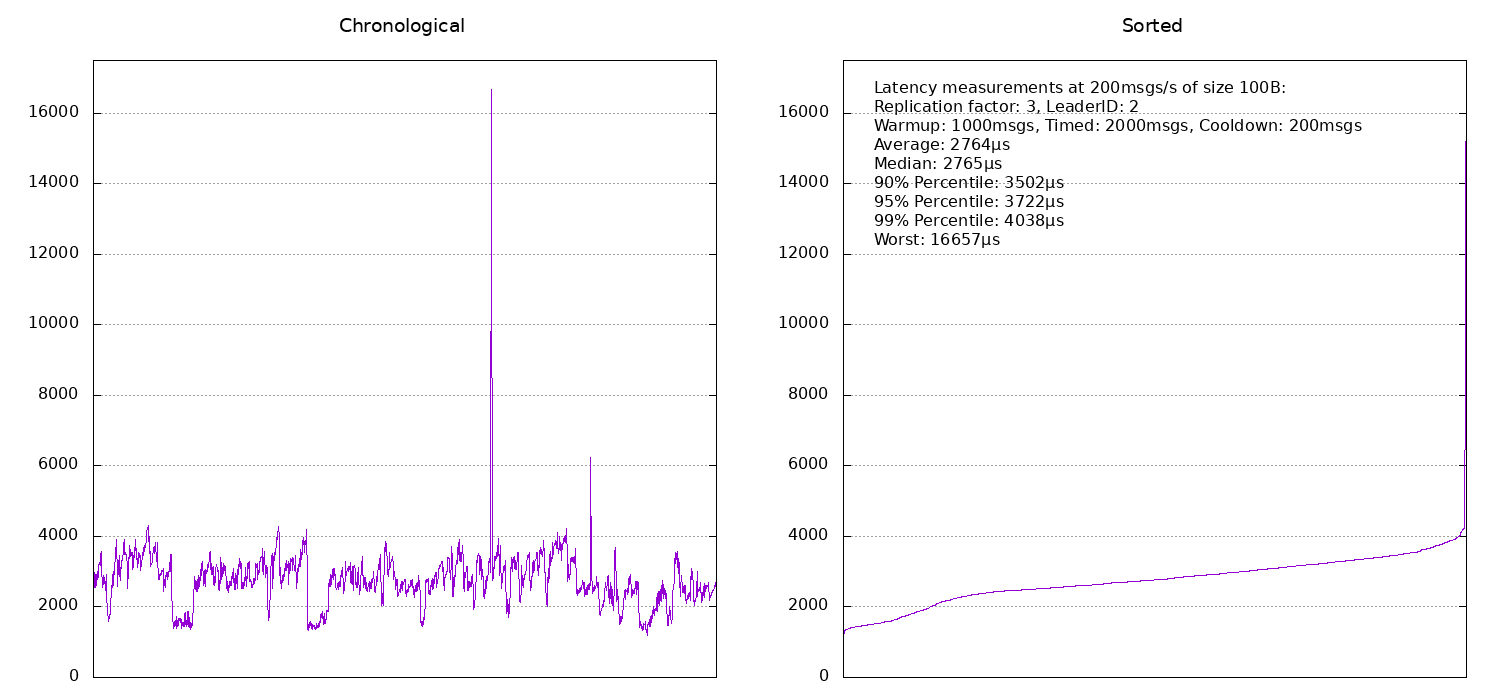
If the benchmark machine is also the leader, latencies are around 2ms and otherwise they are around 2.5ms. It seems that broker number 2 was probably under a bit more load at the time of the benchmark and hence its timings are slightly worse than those for broker number 3.
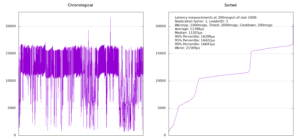
We didn't really systematically benchmark any other message rates or sizes because we just wanted to get an idea of what we can expect. As a rule of thumb, initially latencies will be better as message size and number of messages per second increase. This is up to a point, where other bottlenecks become relevant. In the extreme case, if we are really unreasonable and attempt to send something like 100KB messages at a rate of 1000 messages per second (so that's roughly 100MB/s), then network congestion sets in (remember that we are using Gigabit network here) and we start seeing graphs like this one:
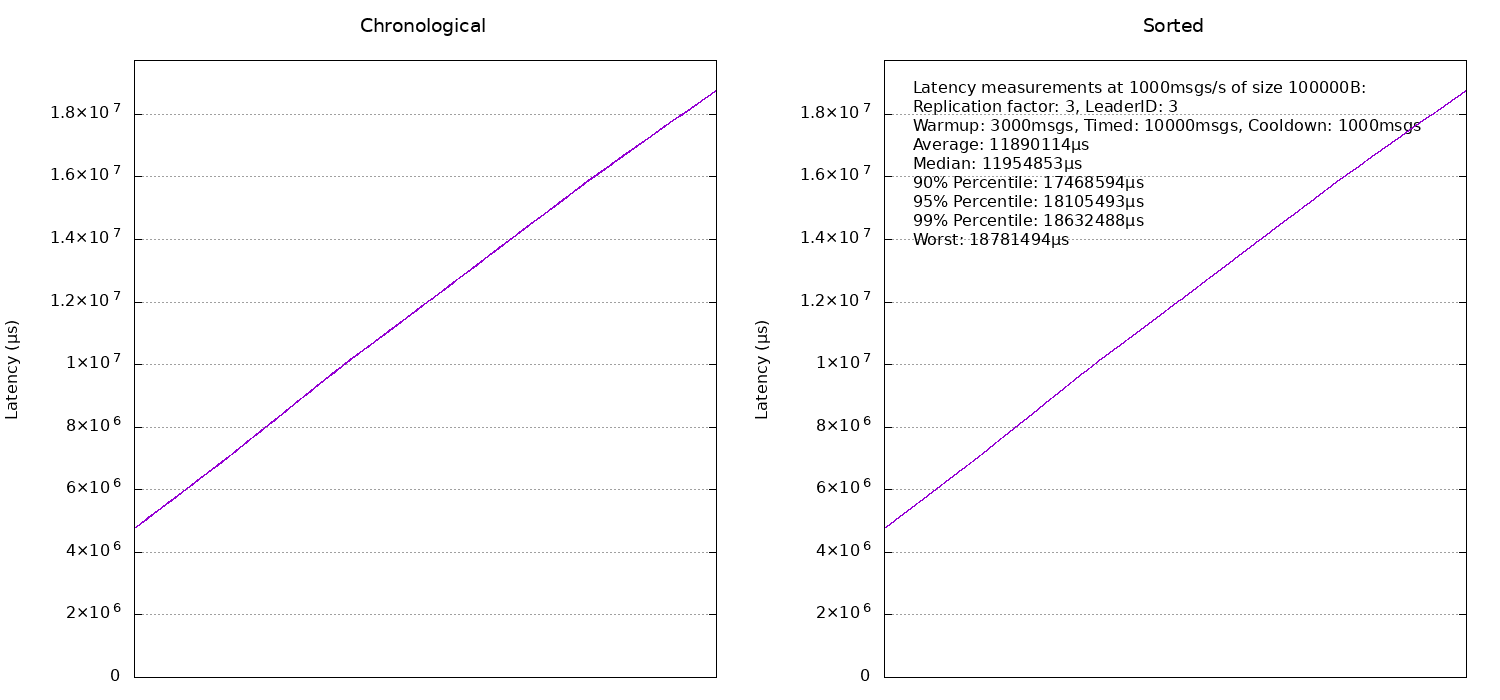
Feel free to do your own experiments (as mentioned at the beginning, all the code is on Github) but be aware that with everything using default configurations, message sizes in the vicinity of 1MB will not work and might either lead to very bad results, the benchmark not being able to run at all because things time out or even a deadlock.
Lessons Learnt
There are a couple of things we can take away from this experience:
- First off, Kafka is really fast. You will find some posts online of people mentioning that Kafka's focus is on persistence rather than latency and so you cannot expect them to be low. This may have been true in the past but is definitely not the case anymore.
- Just using averages is not good practice (but of course, we already knew that, right?). At the very least, you should calculate a handful of percentiles as well.
- Don't underestimate the power of visualising your data. Even adding something like a simple bar plot can reveal things that are not at all obvious just from looking at percentiles and averages.