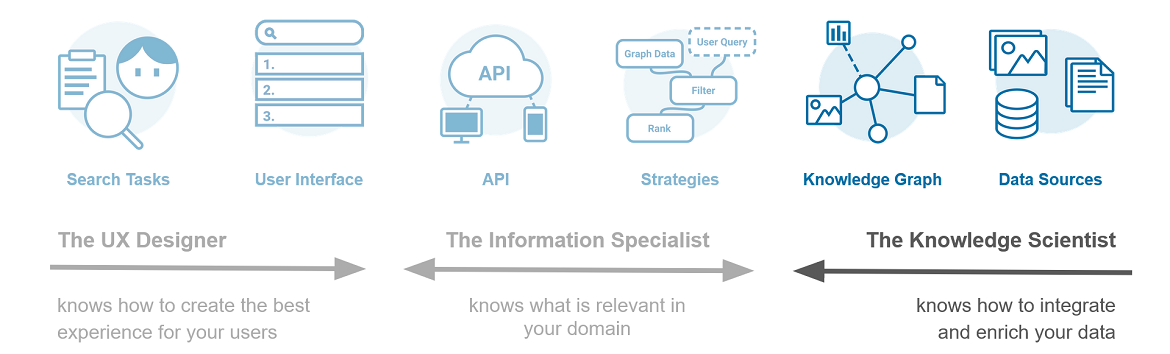
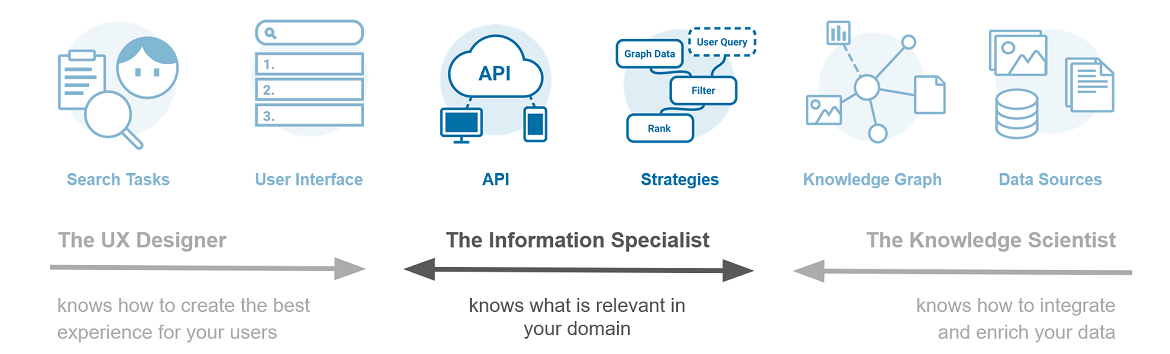
Meet the Team: the Knowledge Scientist
Posted on 12/04/2023 by Peter Tessel
In this blogpost series we introduce the three roles in the search design team. In the previous post we briefly introduced the team as a whole. We now take a closer look at the knowledge scientist.
The task
The task of the knowledge scientist is to make the knowledge within your organization easily accessible. As we discussed in the previous post, in order to achieve this s/he has to solve two challenges: to integrate data from multiple sources and to explicitly represent information that is implicit in your data. S/he does so by creating a suitable knowledge graph, a virtual data layer over the different information systems within your organization. The knowledge graph allows your data to be searched as one and your information to be retrieved according to your users' needs.
The knowledge graph
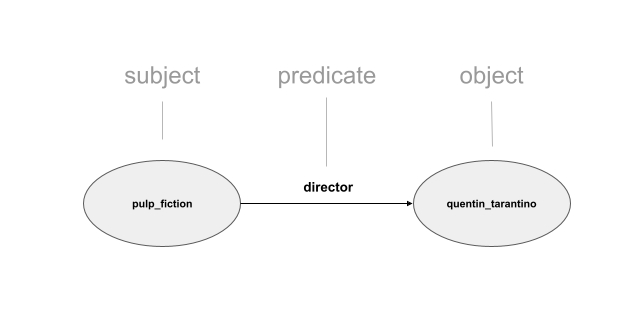
A knowledge scientist creates a knowledge graph by storing the concepts, attributes and relations contained in data sources as Linked Data. This method of data storage was developed by the World Wide Web Consortium (W3C) to facilitate the integration of data on the web and is equally applicable to data sources you encounter within organizations.
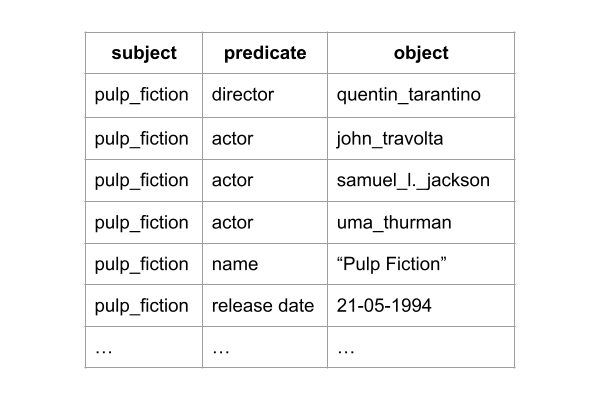
The basic principle of Linked Data is to store data as 'triples'. Triples have the form subject - predicate - object: one resource (the subject) is connected to another resource (the object) via a relation (the predicate). In other words: data is stored as tiny fragments of a network (or graph):
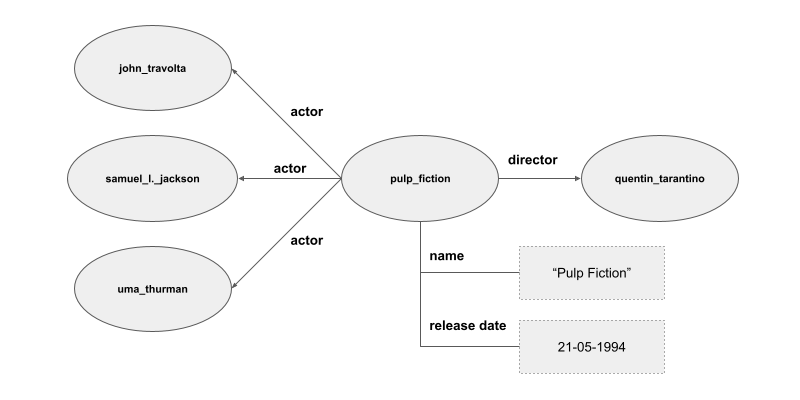
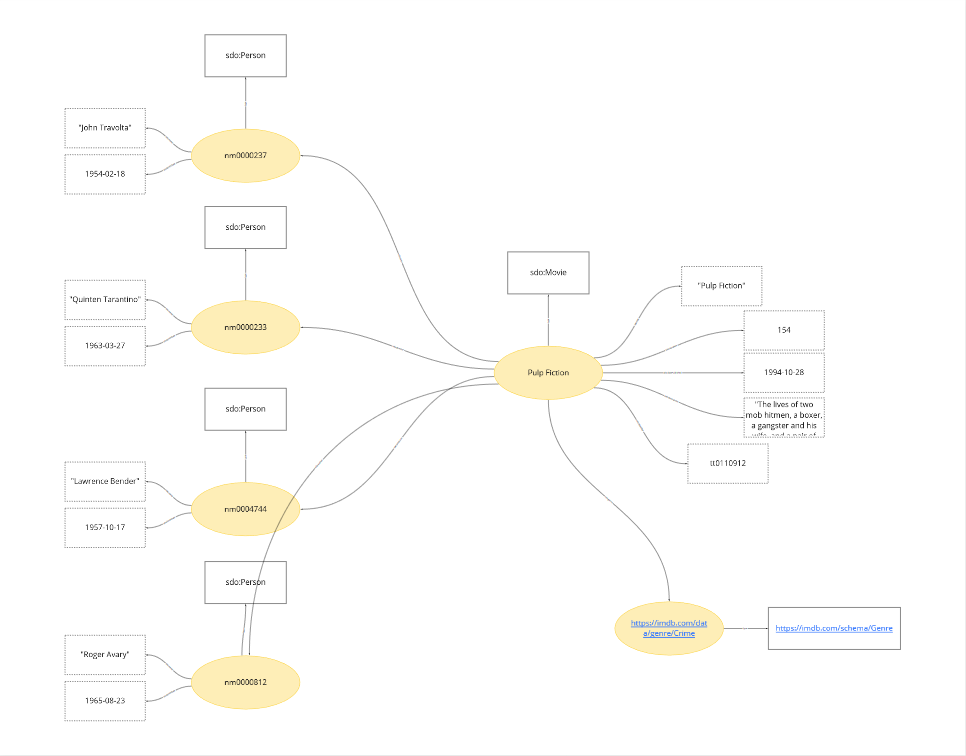
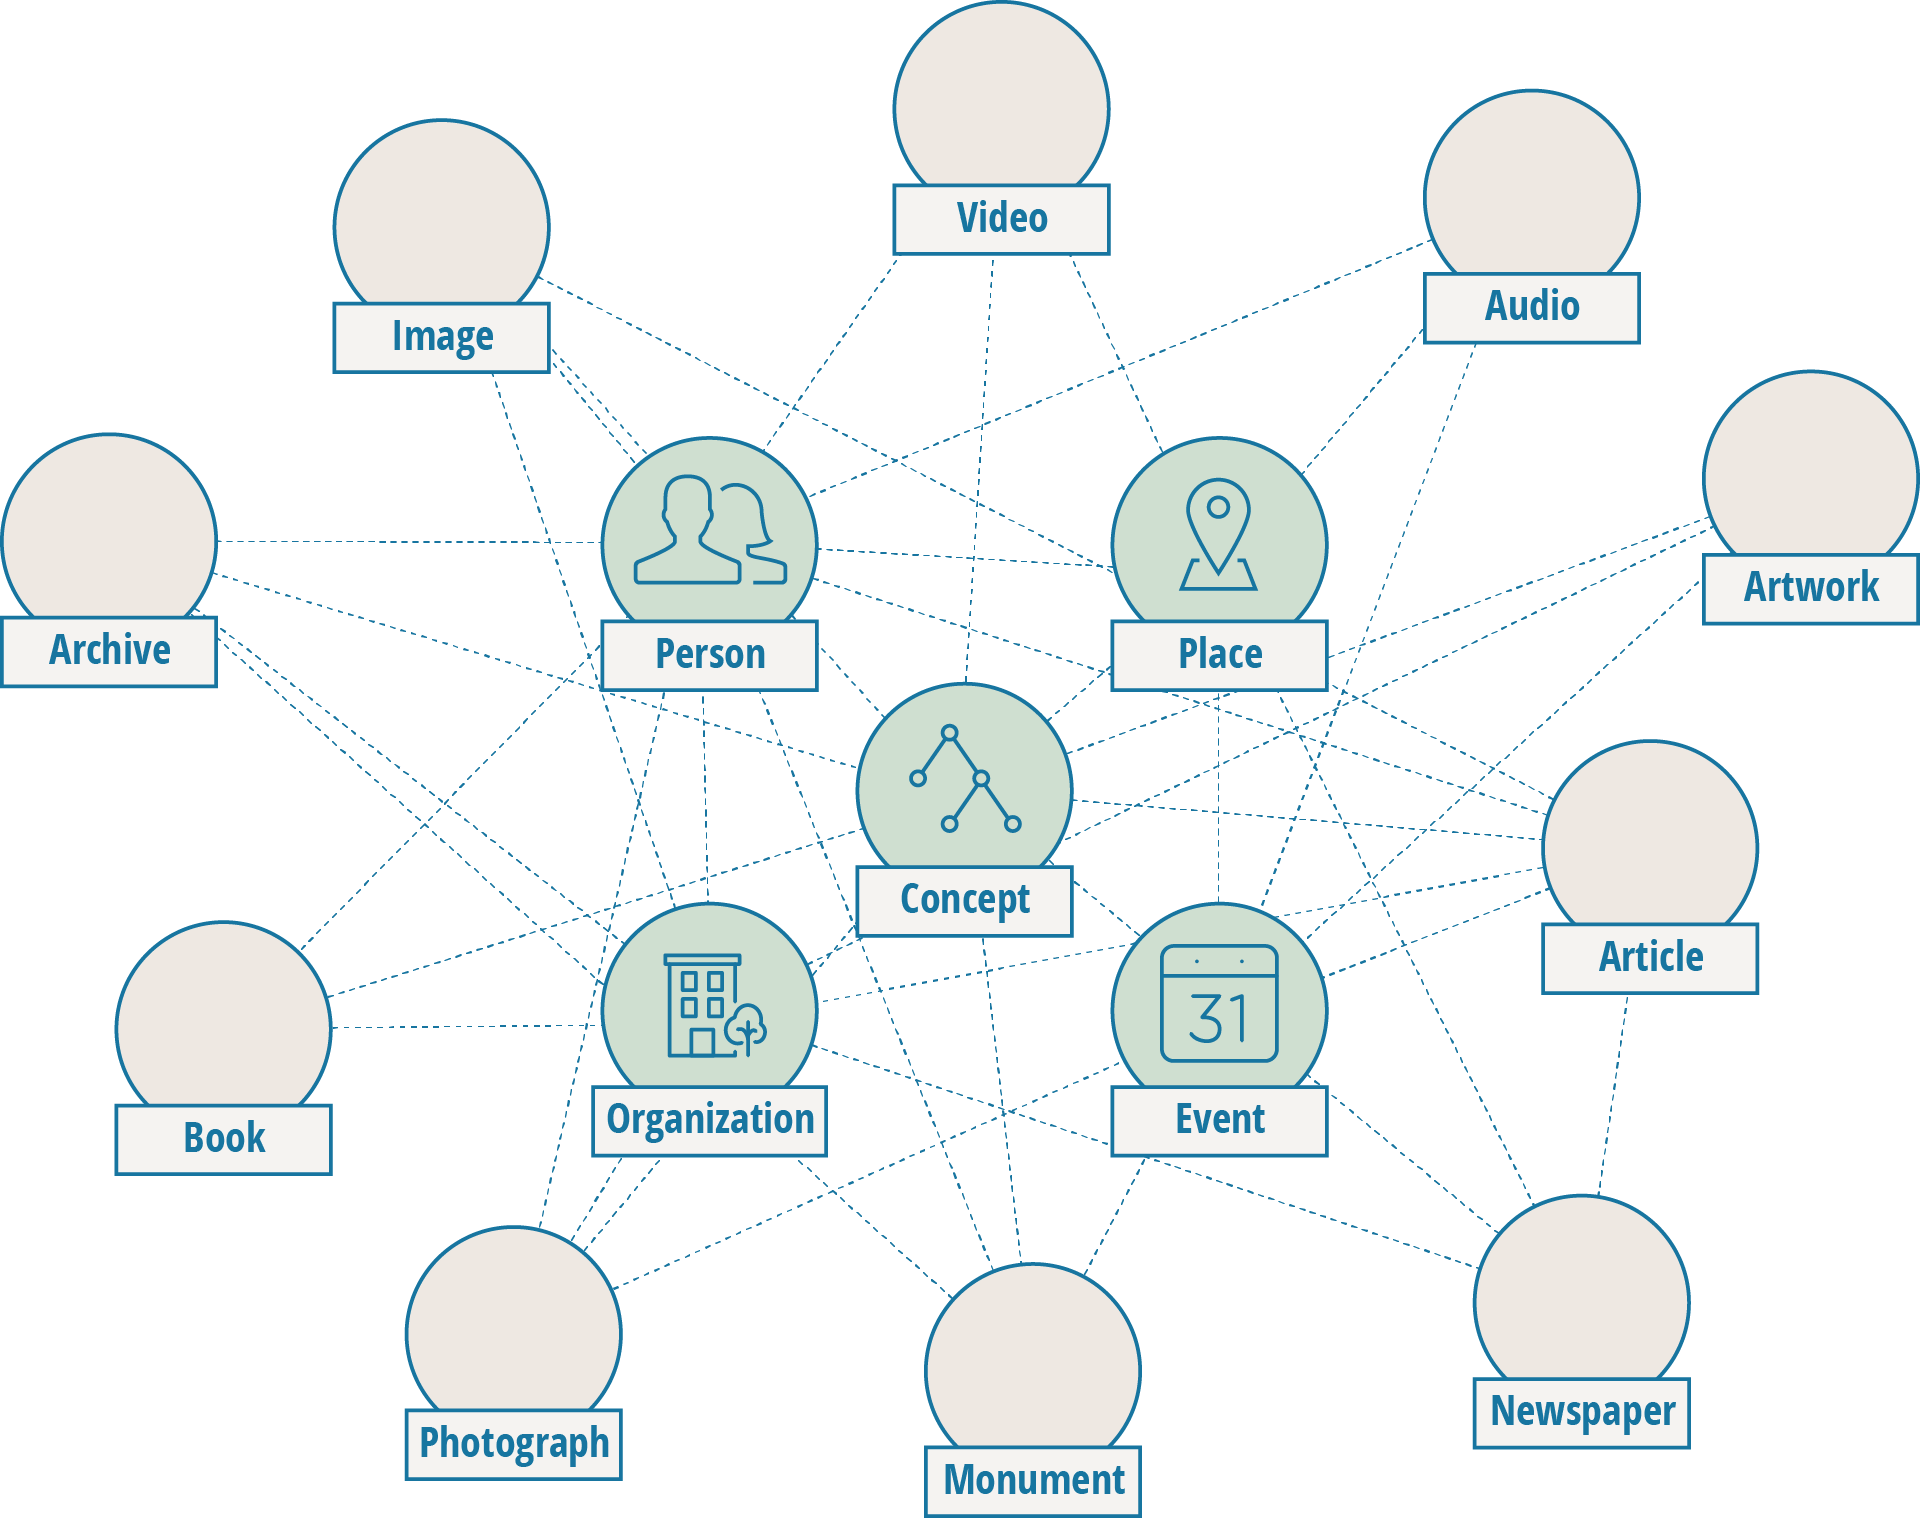
By assigning unique identifiers to these concepts and relations, these fragments are combined together into a large network, a knowledge graph:
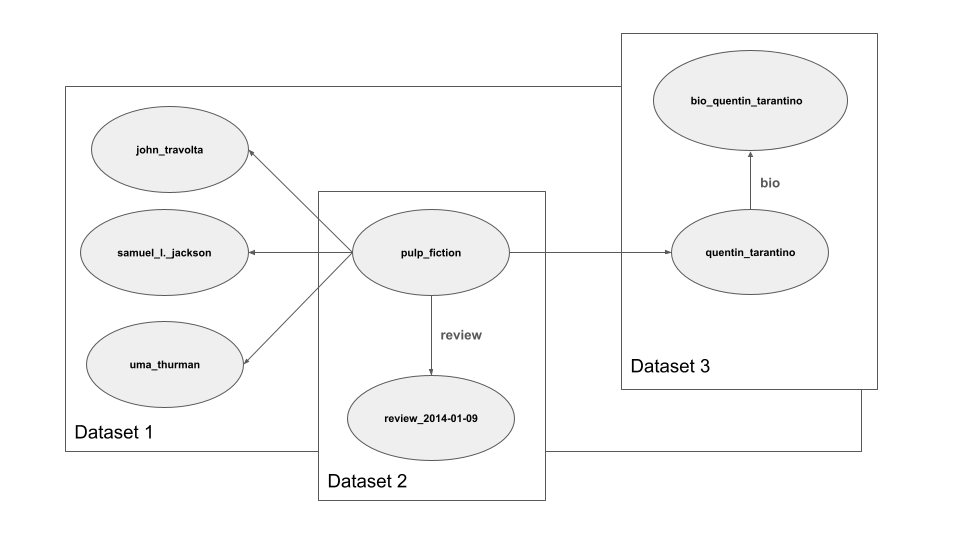
The resulting knowledge graph can be linked to other existing graphs (often on the web) to further enrich the data:
Knowledge graphs are extremely powerful - they allow many different types of information to be linked together into one rich model of a domain. In order to accommodate this power, the graph database does not have a fixed schema: it may contain any type of data, tiny and large, internal and external, (semi-)structured and unstructured.
The process
The knowledge scientist starts the design process together with the information specialist and the UX designer. The team interviews stakeholders, experts and users and thus maps out the problem: what information are users searching for to fulfill their tasks, which data sources are available, when will the project be a success? At the end of this stage the team has a shared understanding of the problem and has extensive lists of search tasks, data sources and project requirements.
Subsequently the team filters all relevant entities from the search tasks: what are the actual concepts users are searching for?
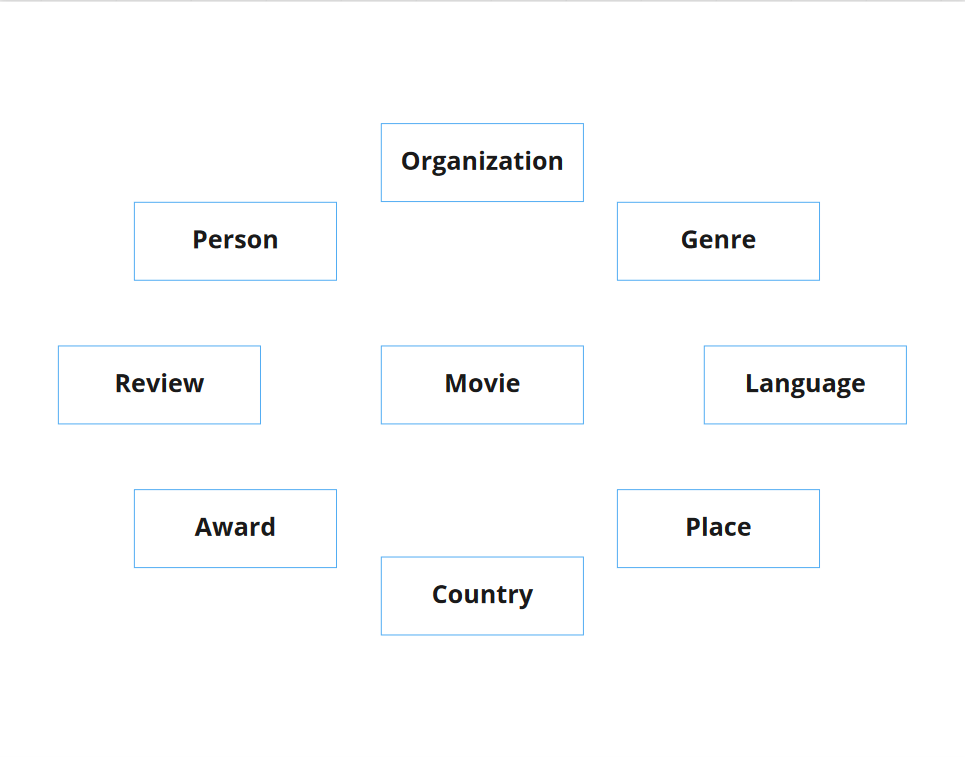
Next the team sketches a conceptual model of the domain by relating the concepts to each other and listing their attributes.
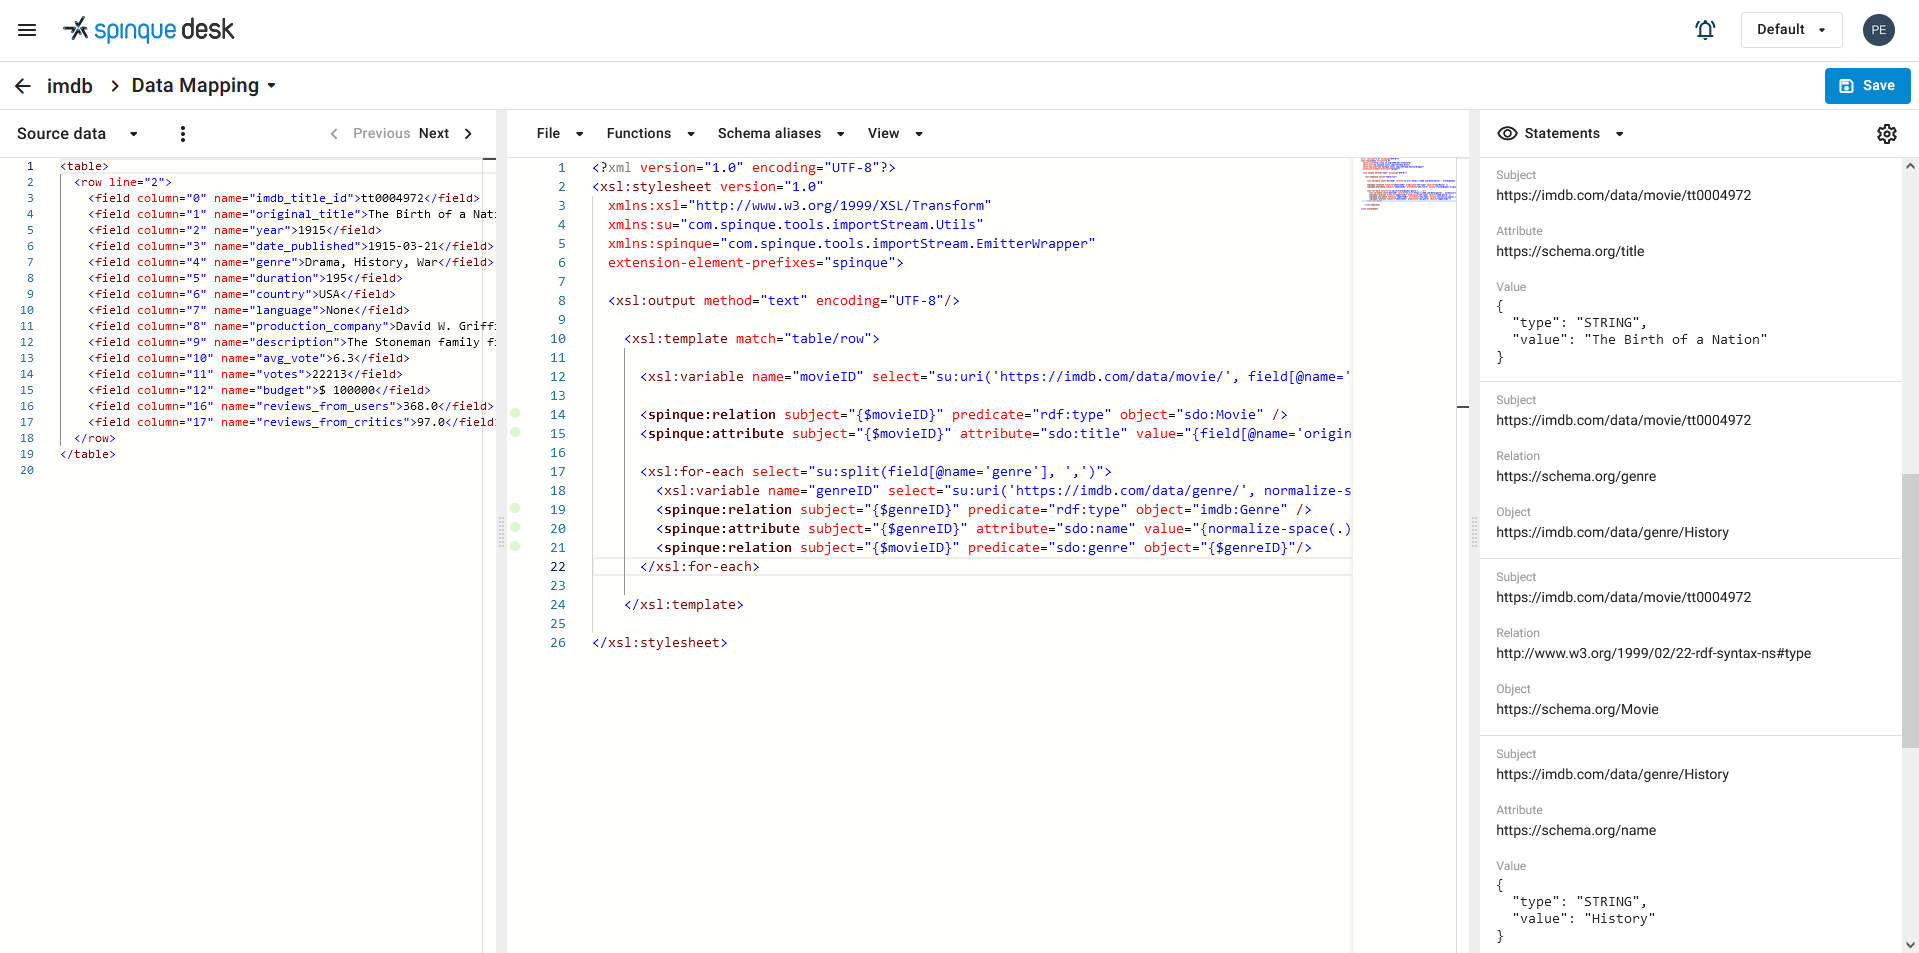
After this preliminary work with the team the knowledge scientist starts creating a prototype knowledge graph by mapping your data to the domain model. In Spinque Desk this is done by creating a data mapping; basically an XSLT stylesheet that is extended with functions that convert your data into triples.
At the same time the information specialist creates prototype search strategies and the UX designer a prototype user interface.
In the next stage the team aligns their prototypes and turns to users for testing. The outcome of these usability tests are used to fine-tune the different parts of the evolving search application. The knowledge scientist may find that s/he overlooked important data sources, did not include relevant data from sources s/he did connect or misrepresented parts of the domain. After fixing these issues and similar ones for the search strategies and user interface the team deploys the search application to production.
The craft
The above may seem pretty straightforward but the creation of a suitable knowledge graph is a craft. The knowledge scientist has to understand the ecosystem of people, data and tasks in an organization and should be able to capture all this knowledge in a fitting model. S/he must be able to put him/herself in the shoes of the users and to value the meaning of data for them, s/he must be able to access data with the help of engineers and to transform it if necessary and s/he must be able to align the knowledge graph with the search strategies to answer the search queries of the users.
By designing the knowledge graph with a concrete application in mind and by regularly testing it with actual users, the knowledge scientist ensures that the design process has a clear direction, that her/his understanding of the domain continually grows and that the data can be accessed as valuable as possible. Three example client cases will explain how this plays out in practice.
Data-driven stories
Several years ago we teamed up with the Dutch Network War Collections (in Dutch: Netwerk Oorlogsbronnen (NOB)) to create a web application that gives access to the information from the many Dutch collections about WWII. Together we created a knowledge graph that links the data from the various collections to the entities in thesauri that the NOB maintains:
Over time the knowledge graph enabled the NOB to develop from a traditional collection portal to a platform for data-driven stories. The collection objects moved from center stage to a role supporting the stories on persons, places and events. By defining the entities that are related to collection objects as 'things' instead of 'strings' it becomes possible to view them from a new perspective, to present them independently and to make them separately accessible:
Relating concepts
The Municipal Clerk's Office (MCO) of the city of Utrecht selected us to help them improve the retrieval of municipal information. This information is typically stored in multiple systems, the most important being the council information system (CIS), the system the MCO uses to plan meetings and to provide council members and other stakeholders with the correct information in a timely manner.
The interviews we held with city councilors during the design process showed that proposals are central to their work. Unlike other so-called instruments city councilors have at their disposal, proposals are usually discussed during several meetings, often have appendices such as reports, explanations or visions and city councilors can use other instruments to amend or supplement them. During our investigation we found that when city councilors searched for proposals, they found separate documents, agenda items, appendices and related instruments such as amendments and motions but nothing that bound them together; the proposal does not exist as a separate concept in the CIS.
In order to properly meet the information needs of city councilors, we added the proposal as a concept to the domain model. Next we created separate entities for all proposals and linked them to the agenda items during which they were discussed. This allowed us to retrieve all agenda items, documents, appendices and related instruments from the CIS in one go and to display them in one overview.
Merging data
The procurement team of this client, a major global brewer, set out to make it easier for buyers to find preferred suppliers for any product they might need. In order to do so they had to combine information from multiple sources: the validity and applicability of contracts, historic purchasing data for operational companies in dozens of countries around the world, information about suppliers, the categorization of products within the company, etc.
In this case we created entities that integrate information that exists throughout the extensive and complex company IT infrastructure of over 20 applications. Creating the entities was a laborious and precise process but with the knowledge graph in place, it became possible to easily reason about suppliers, contracts, materials and persons and thus to get a grip on this complex domain.
Integrated and enriched data
By integrating and enriching your data in a knowledge graph the knowledge scientist thus makes your data and knowledge easily accessible. This in turn enables the information specialist to focus on her/his task: obtaining suitable and relevant search results.
This is the second blog post in a series about the search design team. In the first post we introduced the team as whole, in two upcoming posts we will take a closer look at the work of the information specialist and the UX designer. Stay tuned!